All Pitches of Kepler's Music, Graphics
Graphs as we know them were introduced by
Nicole Oresme around 1350 CE, but the staff notation
for musical pitch was already 400 years old. We
may then regard staff notation as the source of
our graph tradition.
Pitch graphics: the staff and the keyboard
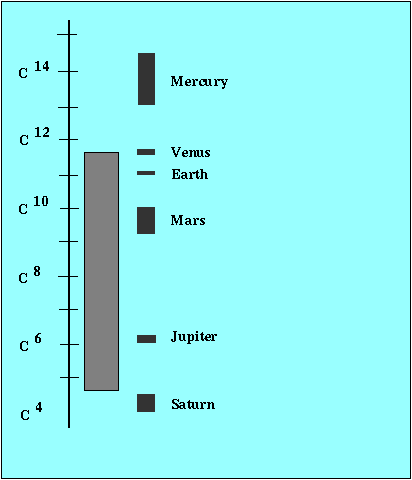
We wish to represent all pitches of Kepler's
Music of the Spheres graphically.
As eleven octaves are required and the traditional
staff notation is awkward for more than four octaves,
we will replace the staff (as a scale of pitch)
with a piano keyboard image, suitably extended on each end.
Thus a time series of pitches (let us say of constant volume)
may be represented as a graph, with the time line horizontal,
and the extended keyboard vertical. We are going to make
use of the keyboard as a vertical axis.
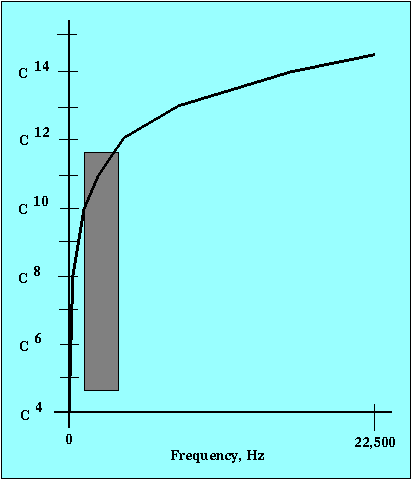
Pitch graphics: the keyboard vs pitch frequency
Suppose the pitch frequency of Middle C on the piano
were 256 Hz. We may denote this as C-256.
Then an octave above would be C-512, an octave
below would be C-128, and so on.
As these frequencies are powers of 2,
we may also write C-28 = C-256, and so on.
Perhaps it will not be too peculiar, in fact, to just
write C8 for C-256.
|


